




GOES-19 CCOR-1
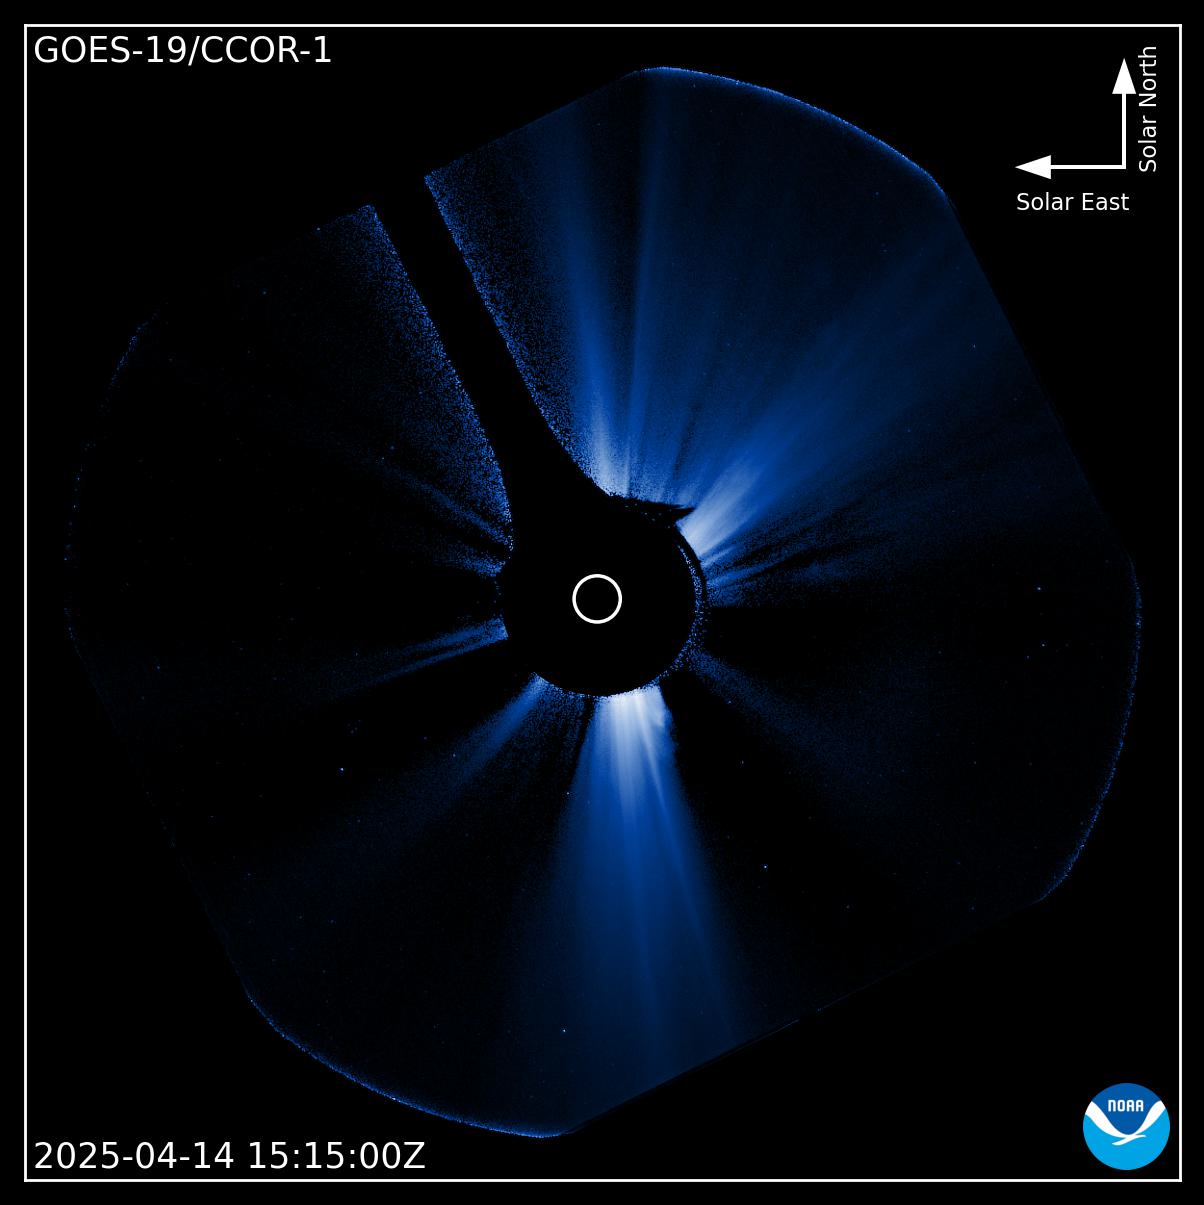
Imagery from the first Compact Coronagraph (CCOR-1) instrument is used by the SWPC Forecast Office to characterize activity in the outermost part of the Sun’s atmosphere known as the corona. There are two types of imagery that are monitored, white light imagery and running-difference imagery. The white light imagery is displayed with the black-blue-white color map while the running-difference imagery is displayed with the grayscale color map. These images are monitored for transient events like coronal mass ejections (CMEs), as well as the impacts the corona has on the steady stream of plasma, referred to as the solar wind, emanating from the Sun. The CCOR images are vital inputs to the WSA-Enlil model, which in turn, is a critical tool for forecasting the impact of Coronal Mass Ejections and the effects of the Solar Wind on the Earth.
SOLAR-1 CCOR-2
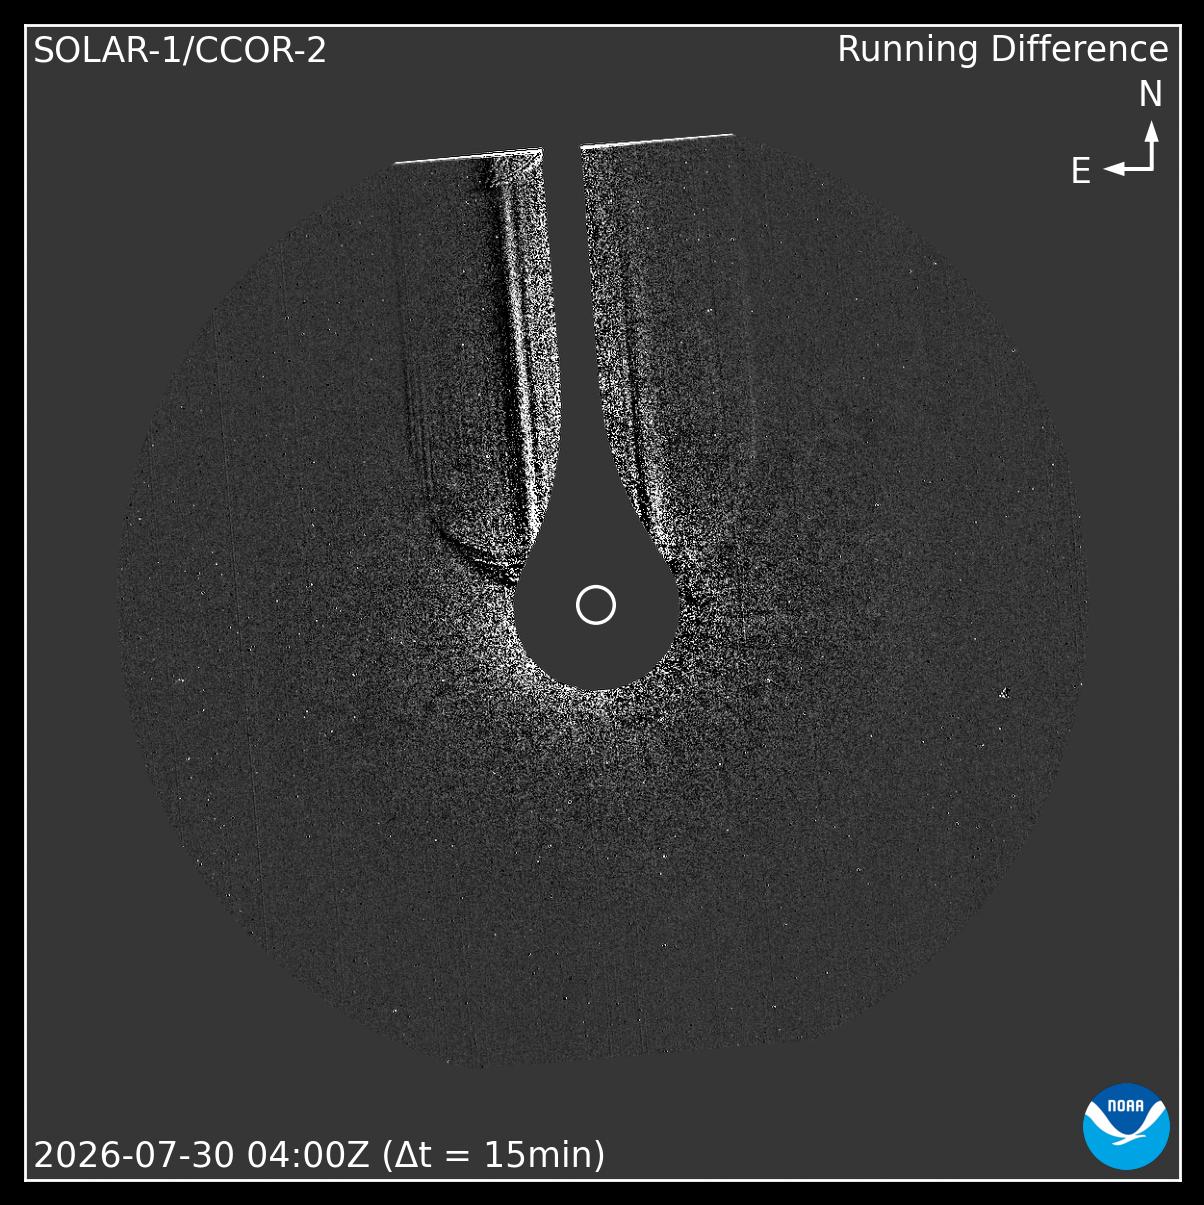
Imagery from Space weather Observations at L1 to Advance Readiness 1 (SOLAR-1)’s Compact Coronagraph (CCOR-2) instrument is used by the SWPC Forecast Office to characterize activity in the outermost part of the Sun’s atmosphere known as the corona. There are two types of imagery that are monitored, white light imagery and running-difference imagery. The white light imagery is displayed with the black-blue-white color map while the running-difference imagery is displayed with the grayscale color map. These images monitor for transient events like coronal mass ejections (CMEs), as well as the impacts the corona has on the steady stream of plasma, referred to as the solar wind, emanating from the Sun. The CCOR images are vital inputs to the WSA-Enlil model, which in turn, is a critical tool for forecasting the impact of Coronal Mass Ejections and the effects of the Solar Wind on the Earth.
CCOR-2 imagery contains visual effects, including small shifts, rings, arcs, bands, or patterns near the edge of an image. These effects occur when small movements within the instrument change how stray light reaches the detector. They do not represent space weather activity and are more apparent in animations and difference imagery. The imagery provides operationally useful observations of the solar corona and supports the sustainment of space weather monitoring. Users are encouraged to consider these instrument-induced effects when viewing and interpreting the data. Additional details on image properties and quality can be found in NCEI’s ReadMe file (https://archive.data.noaa.gov/satellite-spaceweather/SWFO/docs/CCOR/SWFO_CCOR-2_Provisional_ReadMe_V1.0.pdf)
LASCO C2 & C3
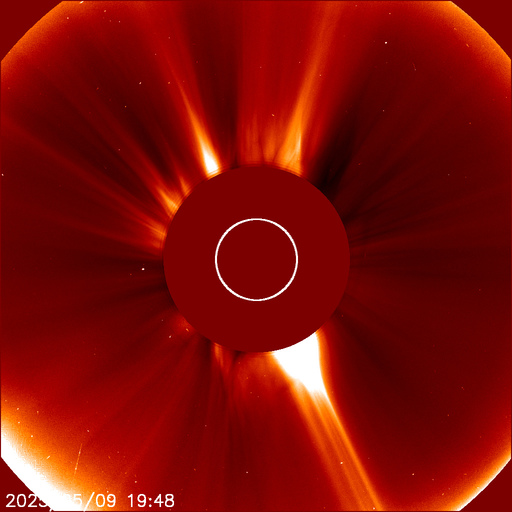
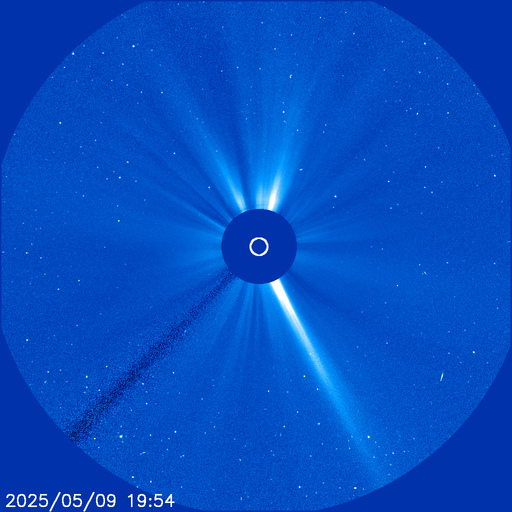
LASCO images are used by the SWPC Forecast Office to characterize activity in the outermost part of the Sun’s atmosphere known as the corona. This includes monitoring data for transient events like coronal mass ejections (CMEs), as well as monitoring the impacts the corona has on the steady stream of plasma, referred to as the solar wind, emanating from the Sun. The LASCO images are vital inputs to the WSA-Enlil model, which in turn, is a critical tool for forecasting the impact of Coronal Mass Ejections and the effects of the Solar Wind on the Earth.
GOES-19 CCOR-1
The Compact Coronagraph-1 (CCOR-1) images the Sun in the visible wavelength range from 480nm to 730nm. In order to detect the much fainter corona, the CCOR-1 instrument uses an occulting disk to block light originating from the much brighter photosphere of the Sun. As a result, the field of view for CCOR-1 spans from 3.7 solar radii out to 17 solar radii with a spatial resolution of ~50 arcseconds. (One solar radius is about 700,000 km, 420,000 miles or 16 arc minutes.) CCOR-1 is one of several instruments mounted on the Sun-Pointing-Platform of the Geostationary Operational Environmental Satellite-19 (GOES-19). The GOES-19 satellite launched on June 25, 2025. More detailed information on the CCOR-1 instrument is available here (link is external).
SOLAR-1 CCOR-2
The CCOR-2 images the Sun in the visible wavelength range from 450nm to 750nm. In order to detect the much fainter corona, the CCOR-2 instrument uses an occulting disk to block light originating from the much brighter photosphere of the Sun. As a result, the field of view for CCOR-2 spans from 3 solar radii out to 22 solar radii with a spatial resolution of ~70 arcseconds. (One solar radius is about 700,000 km, 420,000 miles or 16 arc minutes.) CCOR-2 is one of several instruments onboard the SOLAR-1 satellite, which launched on September 24th, 2025 and arrived at Lagrange Point 1 in early January 2026. More detailed information on the CCOR-2 instrument is available (link is external).
CCOR-2 imagery contains visual effects, including small shifts, rings, arcs, bands, or patterns near the edge of an image. These effects occur when small movements within the instrument change how stray light reaches the detector. They do not represent space weather activity and are more apparent in animations and difference imagery. The imagery provides operationally useful observations of the solar corona and supports the sustainment of space weather monitoring. Users are encouraged to consider these instrument-induced effects when viewing and interpreting the data. Additional details on image properties and quality can be found in NCEI’s ReadMe file (https://archive.data.noaa.gov/satellite-spaceweather/SWFO/docs/CCOR/SWFO_CCOR-2_Provisional_ReadMe_V1.0.pdf)
LASCO C2 & C3
The Large Angle and Spectrometric Coronagraph (LASCO) instrument is one of 11 instruments included on the joint NASA/ESA SOHO (Solar and Heliospheric Observatory) spacecraft, which was launched in 1995. A coronagraph is a telescope that is designed to block light coming from the solar disk in order to see the extremely faint emission from the region around the sun, called the corona. The LASCO instrument is actually a set of three instruments, only two of which (C2 and C3) are still functioning, giving a coverage from 1.5 to 30 solar radii. (One solar radius is about 700,000 km, 420,000 miles or 16 arc minutes.)
GOES-19 CCOR-1
The CCOR-1 instrument is designed to replace the aging LASCO coronagraphs, C2 and C3, onboard the SOHO satellite, which launched in December 1995. CCOR-1 is the world's first operational, space-based coronagraph dedicated to providing an image of the sun’s corona, the faint outermost layer of the solar atmosphere, every 15 minutes. CCOR-1 became operational on April 4, 2025.
SOLAR-1 CCOR-2
The CCOR-2 instrument is designed to work in conjunction with the GOES CCOR-1 instrument in geostationary orbit to replace the aging LASCO coronagraphs, C2 and C3, onboard the SOHO satellite, which launched in December 1995.
LASCO C2 & C3
The LASCO coronagraphs are part of the SOHO suite of instruments that were launched in December of 1995. SWPC has made use of LASCO's images in their Forecast Office and in the WSA-Enlil model since 2011.
GOES-19 CCOR-1
CCOR-1 is a unique instrument being the first operational dedicated coronagraph to support space weather forecasting. It is also the first coronagraph to fly in geostationary orbit around Earth, and this leads to a number of unique features to its observations. Other coronagraphs have observed from the Lagrange-1 point, 1.5 million kilometers away from Earth in the direction of the Sun, well beyond the orbit of the Moon. Since CCOR-1 rides on the GOES-19 satellite, well within the Moon’s orbit, the Moon sometimes makes appearances in the field of view. The combined motion of GOES-19 and the Moon can make it seem to have curved or even looping paths. Another consequence of its proximity to Earth is sunlight that is reflected from the Earth’s natural albedo (e.g. clouds, snow, ice, oceans, etc.) can impact CCOR-1 observations. This reflected sunlight, called Earthshine, impacts CCOR-1 observations primarily during sunrise hours and the degree of the impact depends on the time of year. The effects are most pronounced around the equinoxes in March and September and gradually decay into the solstices. During periods around the equinoxes the Earth can block the sun from CCOR-1’s field of view and in difference images CCOR-1 is sensitive enough to show the nighttime city lights on the planet below. And of course, the CCOR-1 will show the usual moving objects in space, such as planets, comets, satellites, and maybe, once in a while, a tiny piece of space debris. There are also static or fixed artifacts, such as the dark “collar” around the base of the occulting disk that can be seen when the background is bright. Scientists are working to mitigate Earthshine.
CCOR-1 Data Products are available here: https://services.swpc.noaa.gov/products/ccor1/
- L1B FITS Data: These FITS files contain the CCOR-1 image data processed up to L1B and serve as the operational input for the CME Analysis Tool (CAT)
- JPEG Data: These JPEG files are created from the L3 CCOR-1 FITS data, which have been fully calibrated, background subtracted, and down-sampled by a factor of 2
- MP4 Data: These MP4s are created from the JPEGs and contain data spanning three durations: the last 24 hours, the last 7 days, and the last 27 days
SOLAR-1 CCOR-2
CCOR-2 is the first operational dedicated coronagraph to support space weather forecasting from the Lagrange-1 point, 1.5 million kilometers away from Earth in the direction of the Sun. Within the field of view, CCOR-2 will show the usual moving objects in space such as planets and comets along with some fixed features.
CCOR-2 imagery contains visual effects, including small shifts, rings, arcs, bands, or patterns near the edge of an image. These effects occur when small movements within the instrument change how stray light reaches the detector. They do not represent space weather activity and are more apparent in animations and difference imagery. The imagery provides operationally useful observations of the solar corona and supports the sustainment of space weather monitoring. Users are encouraged to consider these instrument-induced effects when viewing and interpreting the data. Additional details on image properties and quality can be found in NCEI’s ReadMe file (https://archive.data.noaa.gov/satellite-spaceweather/SWFO/docs/CCOR/SWFO_CCOR-2_Provisional_ReadMe_V1.0.pdf)
CCOR-2 Data Products are available here: https://services.swpc.noaa.gov/products/ccor2/
- L1A FITS Data: These FITS files contain the CCOR-2 image data processed up to L1A and serve as the operational input for the CME Analysis Tool (CAT)
- JPEG Data: These JPEG files are created from the L3 CCOR-2 FITS data, which have been fully calibrated, background subtracted, and down-sampled by a factor of 2
- MP4 Data: These MP4s are created from the JPEGs and contain data spanning three durations: the last 24 hours, the last 7 days, and the last 27 days
LASCO C2 & C3
Realtime images from the LASCO coronagraphs also are available from NASA here (link is external).